Wednesday, August 15, 2007

Playing With Fire....Errr, Volatility

Hey Gang:

Don't know about you, but my head has been on a swivel as a trader (not a long-term investor) with the CRAZY market swings as of late. What looks to have been solid entry points on good trending stocks with good fundamentals has been as exercise in futility. So how can you defend yourself during such volatile times? Here are some suggestions from one of my INVESTools coaches:

  1. Stay in cash until the market settles and SOME direction is established
  2. Enter in positions HALF the size as normal, and make the Stop-Loss trigger TWICE as big to give yourself some good wiggle room on wild swings
  3. For existing trades, leave the Stop-Loss triggers where you originally set them, DO NOT make them lower!
  4. For existing trades, look to take profits at resistance levels
  5. Finally, don't be real anxious to play downside breakouts for bearish trades. While many stocks are making "lower lows" it is too soon to say that we have actually started down-trending UNTIL we start testing old support levels as new resistance. Wait for the Lower Low AND the Lower High (and if you want to be really conservative wait for a subsequent lower low.)
  6. Spread strategies can be used during these times as well.
That's it. Keep your powder dry and while this market keeps falling (12,600 on the Dow would be a 10% Correction from 14,000), there could be some EXCELLENT buying opportunities on the horizon.

Until next time, Happy Trading!

Wednesday, August 1, 2007

Closed Out VLO, JOSB & ESV

Well Traders, the market swings are becoming absurd. I closed out of three positions today...VLO (for an outstanding profit though it would have been better 2 weeks ago), ESV and JOSB for reasonable losses (less than 1% of portfolio). The VLO gains FAR outweighed the losses so I was in good shape.

I still have positions in BHP, CMTL, STLD and UTX.

Always on my radar are ACH, AKAM, ATW, BOOM, BUCY, CAM, CCJ, CHL, CLF, CROX, CX, EXP, FCX, GRMN, JEC, LFC, MOS, NVDA, PCAR, PICO, RDC, RIO, SBUX, SNDA, STLD, STP, SU, TIE, TDW, UNT, VLO & WFT...to name a few. I have about 300 stocks I look at on a daily basis and while that may seem like a lot, I am so used to the charts that I can almost instaneously recognize if a chart warrants further investigation and analysis.

Regarding PG, it looks like a Bullish Engulfing pattern today, right before earnings.

Happy Trading!

Tuesday, July 31, 2007

Sucker Punched

Volatile markets suck, plain & simple. Today, I got sucker punched by a trade in Target (TGT). I had a Buy-Stop set up if the stock continued its bounce and headed up, which was triggered, only to have AHM CRUSH the rally today, sending TGT down heavily, hitting my Stop-Loss and creating a nice Bearish Engulfing pattern to boot (circled in blue). Here's the chart:
Oh well, such is life as a Trader.

I did enter a few more trades (CMTL, ESV, JOSB, STLD, UTX) on Buy-Stops which were all doing well until the AHM news really took the steam out of a nice rally. Hopefully the market won't go too much further south, but it may. That's what Stop-Loss triggers are for! I am going to watch those trades for now and see where they run before I enter any more.

Back to PG:As was discussed yesterday, I felt that a Bear Call spread was a good play based on the position in the channel, and it was as the stock fell towards support. If you wanted to play an Iron Condor, you could Leg-Into a Bull Put Spread once the stock reached the support of the channel.

Happy Trading!

Monday, July 30, 2007

Some Possible Trades

Hey Gang:

Here are some plays I am currently looking at.

CMTL

ESV

JEC

STLD

UTX

I also got into BHP (@ $63.32) on Monday and sold some September $67.50 Covered Calls for $2.50.

Happy Trading!

Take a Gamble on Proctor & Gamble "PG"

PG huh...a Bull Put Spread and/or an Iron Condor. Let's take a look see shall we and see what we uncover?Well, our first rule of thumb for any Credit spread is we want one of two things happening. First, ideally we want the stock to be trending AWAY from the credit spread, which back when the Triad Traders met, would be a Bull Put. As of today though, the credit spread to enter would be a Bear Call since we have seemingly reached the resistance level of our horizontal (neutral) channel. The second thing we would like to see is a neutral trend in the stock, showing that it has little to no real overall movement. As you can see from the chart, PG has been rangebound for months...that's good for this type of trade!

As Keith pointed out in his comment, an Iron Condor on PG looks like a solid bet based on the flat, rangebound trading levels over the past few months. Certainly a 65/70 Bear Call and 60/55 Bull Put spread look to be somewhat safe based on the support and resistance levels. One caveat though, earnings are fast approaching so it may be dicey getting into any trade at this point.

For argument's sake, let's "leg-in" to an Iron Condor. Right now, since the stock is at channel resistance, I'd first play a Bear Call Spread at 65/70. As of today (after hours), the September 65/70 spread would net me a $1.00 credit ($1.10/$0.10), or a 1:4 Reward/Risk ratio...typically lousy of an Iron Condor. I would then wait for the stock to move back to support before entering the Bull Put spread to close the IC. My hopes would be that the stock ended up somewhere between $60.01 and $64.99 (preferably not THAT close) on OED in September.

Of course, you would need to set up your Stop-Loss points, and/or decide to close the short side of one of the spreads if the stock began to move against you.

Happy Trading!

Thursday, July 26, 2007

When the going gets TOUGH...

The TOUGH go to Tim Knight, founder of Prophet.net and my FAVORITE Bear Blog, The Slope of Hope. Tim is an Uber-Bear, so he THRIVES on down markets, so in my opinion, it is a GREAT place to find shelter (and get some awesome Bearish ideas) in turbulent times like now.

I am in all cash right now, with the exception of VLO, which I have held a long time, and will continue to hold and sell Covered Calls. However, if this is the start of a correction (and there are a LOT of broken support lines today), then it could ba a time to back up the truck and wait for some excellent buying opportunities.

If this seems to be a longer term Bear trend, and you don't like to short the market or buy Puts, you can always buy the Bearish ETF's: DXD (Dow), QID (NASDAQ) and SDS (S&P).

This also may be a good time for some "Dead Cat Bounces," stocks which get pummeled in earnings (or get dropped for no other reason but the sector/market tide is moving out), but end up rebounding a few points a few days later.

Let's get some ideas out there for the group to analyze some trades and put our collective heads together and make some MAAAAAAD MONEY! (I made a LOT of $$$ using the "Force Index" indicator which I never knew of until I attended April's meeting...so yes, we ALL can learn a little something together!)

Remember....ALWAYS, ALWAYS, ALWAYS manage your risk!!!

Happy Trading

Monday, July 23, 2007

Gettin' Back In the Groove

Hey Gang:

For those of you that hadn't heard, my wife Sylvia gave birth to our son, Ethan on May 17th. For those of you who are parents, you know the sea change my life has taken...for the better! Now that Ethan is starting to sleep longer, and by association, his father, I'll be able to get back into the blog. So, check back here to see any updates, and be sure to make any suggestions for plays.


A Valuable Lesson Learned


Recently, I had a position in CAT which reported earnings on Friday, which was Options Expiration Day. In hindsight, I missed a GOLDEN opportunity to make a LOT of money with limited risk. How? By playing a July $85 Put on Thursday. The high on thursday was $87.00, and you could have bought an "expensive" July $85 put for $0.85. I say expensive since $0.85 seems a lot for a stock that is $2 OTM. Anyway, for a one day play, it was "cheap" in the sense 10 contracts was worth $850, but if the stock plummeted, you could make a bundle.


So what happened?


CAT tanked over $7 at the open (and was down over $8.00 at one point) and the July $85 Puts went from $0.85 to over $6.00! That is a 706% return in one day!!

What's the lesson?


Perhaps next earnings season, you may want to see which companies report on that Thursday, and see if there are some "cheap" Puts/Calls to play for October's expiration? Just an idea...I welcome yours!

As an aside, you'll note the PERFECT bounce off channel support...


Happy Trading!

Tuesday, May 15, 2007

$NDX Bull vs. Bear Battle Royale

Hey Gang:

I haven't posted much because our first child, Ethan, is due on Thursday.

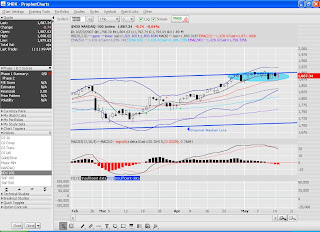
My last post was about "Sell in May and go away." Well, the market hasn't shown much selling lately, but there seems to be a Battle Royale at the top of the $NDX Ascending Channel. Here is the chart:

The $NDX has neutralized its trend and just doesn't seem to know what to do. The MACD suggests that a downturn may be imminent, but this market has seemed to have a mind of its own. For all the "bad" news that has been tossed around (the Fed pausing again notwithstanding), I am surprised the market hasn't begun selling off into summer...yet.

Anyway, hope y'all are well and Happy Trading!

Monday, April 30, 2007

Sell In May and Go Away?!?

"Sell In May and Go Away."

That is a famous rhyme from Wall Street. The theory is that the senior traders move from Wall Street to the Hamptons for the summer and the junior traders take over. This has been a trend for the past few years, and with the phenomenal run up the past two months after February 27, will the Big Boys sell off, happy with their profits and head for the beach? Time will tell, but here is an interesting look at the $NDX:

The 5 year chart shows a clearly defined Ascending Channel:
A closer look o n the 1 year chart reveals the index is at the Channel Resistance.
An even closer look at the 3 Month chart reveals the index hit resistance a couple of days ago and has begun to fall off. By looking at the 1 Year chart above, you can see how far the $NDX could potentially fall if it repeats last year's action. Something to be mindful of.

So what can you do to play the "Bearish" side of the market (but hate Puts and Shorts)? Buy DXD (Dow), QID (NASDAQ) and SDS (S&P 500) ETF's which allow to to "buy" a bearish position.

Happy Trading!

Wednesday, April 18, 2007

Oil and Gas Operations

Hey Gang:

Just a quick FYI...there seems to be a incoming tide into Oil and Gas Operations ($OILPRD) as there has been a heavy flow of institutional money into the sector recently. Here is a quick snapshot of the Big Chart on VLO.

The sector was at a low of "0" back on 2/2, but now it is at "86." That is a sector rotation if I ever saw one. Perhaps with summer driving season coming up, they are looking at the refiners like VLO, TSO and company?

Happy Trading!

Monday, April 16, 2007

CCJ En Fuego, ZHNE, and More!

Hey Gang:

CCJ is "En Fuego," the stock is just a machine right now. Uranium prices are soaring and CCJ is benefitting nicely. So today, the stock broke through the Ascending Channel I drew so now what can we surmise from the chart? Let's take a look:


It looks like the stock has found a new base to jump off from (see Blue area), so we could (not a recommendation) buy here, and set a 1% Swing trade trailing stop and see how high this could go.

Let's look at yesterday's suggestion, ZHNE. I stated that there was heavy insider buying, and a classic three Green Arrow signal. I got in today, so let's see what happened:

BIG pop relatively speaking. Sure, it was only $0.16, but on a $1.33 stock, that represents a 12% move. That's pretty big, and look at the volume the last two days. The stock also smashed through the 200 DMA which now becomes support. Something BIG seems ready to happen here, hopefully something GOOD!

A couple of more plays I am interested in:

BBY

SBUX
Until next time...Happy Trading!

Sunday, April 15, 2007

In the ZHONE and CCJ Update

Hey Gang:

A few days ago I mentioned CCJ as a play that was following a chart pattern I set up to try and predict its movement. I even showed a Bearish Engulfing Pattern as possible evidence that a downturn may be imminent, along with the STO and MACD. Well, after two somewhat blase days, the stock popped up almost $2 on some good news from the Canadian government, as well as some pumping on CNBC. Had I been in a short term Bearish play (which I was not since I don't play the bearish side of a swing trade when the predominent trend is Bullish), I would be getting near my stop-loss of 1% above the high on 4/10/2007 which is $47.97. Here is the chart:

The trade still hasn't broken above the upper resistance line yet, and the stock is still oversold with a falling MACD, so let's see how it plays out. Ideally, I want to enter this trade where I have placed a green oval, which is at the channel support line.

Into the ZHONE

Every once in awhile when I peruse the Yahoo! Finance message boards, I come across a suggestion that piques my interest. On Friday, someone mentioned Zhone (ZHNE), a company I had never heard of. The post mentioned that there was significant insider buying, and the stock made a significant move, so I checked it out and here's what I found:

So here is a CLASSIC INVESTools (technical) entry signal IMHO, three (3) Green Arrows on BIG volume on an uptrending stock. By the way, did you notice the stock price of $1.30? Even better, this is NOT an OTC stock or one of those "Pump & Dump" spam mail stocks you get. This is a NASDAQ listed company, so to me that says "legit." How about the insider buying? Check this out:

So as you can see, there has been some decent amount of insider buying recently which may bode well for the future. If the top brass is buying stock on the open market, they obviously believe something good is going to happen in the future...they are betting their own money on it.

Just something to consider.

Happy Trading!

Tuesday, April 10, 2007

Charting Beauty

Hey Gang:

Every once in awhile, a chart I set up to predict its movement goes "perfect." If it does what I anticipated it would do, which gives me some confidence to trade it. Take a look at CCJ. I initially set up my Ascending Channel by using the bottoms of 11/17/06 and 3/5/07, then moving to the top of 12/14/06 to complete the Channel, then "extend." Now technically, a line is supposed to connect three (3) points to be legitimate, but I do this method a lot to try to establish a pattern. In this case, it may have worked. Today the stock began at the Resistance line and has fallen off all day. You'll note the stock has been overbought (high STO) for awhile, and the MACD has started rolling over and heading down.

You'll also notice a Bearish Engulfing Pattern which I have circled in blue. This anticipates more downside is coming, more possible confirmation that a short/put may be a good play.

You could short this stock now with a good Reward/Risk ratio since the Stop-Loss is 1% above today's high (resistance) and your target is the bottom of the Channel. The Channel itself is over $9.00, so you could hope to capture most of that preferably before earnings. I would not play this over earnings, but get out before.


Just something to consider.

Happy Trading!

Saturday, April 7, 2007

"The Trend is Your Friend...

...Until it ENDS!"

Hey Gang:

As you will note by my last post, I had been somewhat bearish on the market. The trend signals were also pointing bearish, and the economic indicators were also bearish. With that in mind, and my QID and DOG charts seemingly bouncing I got in two trades. On Wednesday, I got out.

One of my trading rules is to exit any trade that falls below, and stays below support for two (2) consecutive days. That happened on Wednesday. Here are the charts:

DOG

QID
For me, it is okay to be wrong, but never okay to second guess if the market will do what you expected it to. In this case, I expected the market to go down (and UP on my Bearish ETF's), it did not, so I abandoned the positions for small losses and have moved on.

So now what? Well, we are coming into Earnings Season, always a tricky time to play stocks especially over Earnings. So if I can get into some plays that I see reaching a peak BEFORE earnings, I may play them. I have some of my favorite trades that are still overbought from when I was taken out in March (look at BHP, CLF and DVN...), so i need to be patient for a pullback before I can think about getting in. HUM which was a previous suggestion by a member is doing well. I did get into a small position on GRMN, which I saw as bouncing at the bottom of a very high Ascending Channel which made the reward/risk ratio pretty juicy:

I'll let you know if I have any other trades i am looking at playing when I come across them.

Happy Trading!

Thursday, March 29, 2007

"Bear" With Me

Hey Gang:

Sorry I missed the meeting Monday, hope those who attended had a great time and shared some good ideas.

I'm feeling down (as in the Market) so "Bear" with me. I mentioned in my previous post that I felt the Market was going south. I still belive that, especially with oil prices soaring, gas prices soaring, the housing market is getting really bad, the Fed still has some inflation worries, etc. I have started entering Bearish positions in my portfolio (NOT a recommendation). I have been buying Bearish ETF's, the DOG (Dow) and the QID (NASDAQ). Here are the charts:

DOG
QIDYou can see on both charts I have my pre-set target prices where I either exit, or move my stop-loss price tighter. Technically, these were good entry days as the MACD and STO were favorable for a rise, and the "bounce" off the diagonal support seemed to give me my "go" signal. I also like this trade now because "Sell In May and Go Away" is just around the corner. If you look back on last year's chart, you'll see what happened then. That is NOT to say it will happen again, but it seems to be the pre-summer trend when the trading moguls retire to the Hamptons for the summer and let the junior traders take over. Hopefully this trend will continue.

A caveat about DOG, it isn't as heavily traded as DXD (which is probably a better ETF since it is more "liquid"), so you may want to look into DXD instead.

Chris Harding I was told is in a particluar trade I follow (and have done well with) - PCAR. Here is the chart:Again, one of those Channeling, Bouncing trades (notice I didn't say "stock") I love. Clear, defined Entry and Covered Call signals on an uptrending stock. I am out of this position now, though I have highlighted my anticipated entry area.

Some other "favorites" are: BHP, BUCY, CCJ, DVN, FCX, GRMN, PICO, TIE, to name a few.

Happy Trading!

Monday, March 26, 2007

The "Bouncing Sector"

Hey Gang:

First, I'd like to thank Garvie and David Chambers for a GREAT lunch at Elizabeth's Pizza in Quaker Village last week. We had a very nice get-together to talk about a variety of investing subjects. I appreciate their confidence and curiosity in what I had to say, and I hope their lunch money was well spent. My wife, Sylvia thanks you too for her lunch. Finally, I will not be able to attend tonight's meeting because I have a more important engagement, birthing class with my wife. We are expecting our first child late May, so these classes are important. I should be able to attend the next meeting in April, and of course in the meantime, I'll continue the blog.

Y'all know I am a BIG fan of "bouncing" stocks. You know, uptrending stocks in established channels where I can buy on the bounce, and sell Covered Calls at Channel Resistance. Well, I MAY have found the motherload. Utilities.

I was looking at various components of Sector ETFs and noticed that Utility stocks have a very strong propensity to Channel and Bounce. Here are some examples:

AEP

CMS

CNP
ED
PPLThe charts are pretty self-explanatory. I have these on my watch list, so when the return to their support levels, I'll be entering a couple.

Overall, the market is pretty overbought IMHO (In My Humble Opinion), and the bad housing data (surprise!) didn't help with any Bullish sentiment. Here is th $INDU:

The MACD and STO indicate the recent run-up may be over for now, and we can expect a fall-back, probably to $12,300. If it drops below that, then it may come back to the top of the Major Ascending Channel (in Blue).

Here is the $COMPQ (NASDAQ Composite) 2-Year

Again, the market looks overbought and I expect a retracement to the targets I have highlighted in RED.

I hope y'all have a good meeting and I look forward to seeing you next time.

Happy Trading!

Thursday, March 22, 2007

The Fed Aftermath and a FAVORITE Trade

Hey Y'all, as expected yesterday the Fed did BUPKIS to the interest rate which was to the surprise of no one. As I mentioned in yesterday's post, that was not going to move themarket, but what was in the Fed's statement that would. I was right, but I was confused as to why. The Fed's statement lamented on inflationary pressures still present in the economy, but there was something in there that put the Bulls minds' at ease, and they ran with it.

From the chart you'll see that we broke both Horizontal Resistance, as well as broke above the 30DMA. I have highlights where I believe the market will stall out before declining again near May.

I am a little upset with myself in that the big $240 point drop took me out of a lot of positions that would be really profitable today if I had got back in the next day, but since I felt the correction hadn't ceased, I played it safe. You live and you learn...and a cash position in times of volatility and uncertainty isn't a BAD thing either.

A FAVORITE Trade - CLF

Notice how I did not say "favorite STOCK?" As I mentioned at our last meeting, I DON'T LIKE STOCKS! Why? THEY DON'T LIKE ME. Heck, stocks don't even know I exist (kind of like the Head Cheerleader in High School, but that is a story for another time). I don't care about the stock, I care about the Trade. Does it fit my rules? Does it have good Reward/Risk. Am I confident in the trend?

Honestly, I don't try to follow too many stocks...too much time wasted on companies that don't present good opportunities. I like to focus on about 250 stocks and just keep waiting on them, and playing them over and over and over again. I become familiar with them, I understand their opportunities and their risks. Most importantly, I am comfortable and confident with these trades, which makes them more effective for me.

If you can find trades like CLF that you play over and over and over, and even wait on them when they go through their down cycles or play shorts/puts, then you' find a comfort zone and increased confidence...and make money along the way.

Finally, I want to mention this is OUR BLOG, not mine. I HIGHLY ENCOURAGE all of you to submit ideas. By having more eyes on the prize, we can ALL get great ideas for trades. We are not competing against one another, this is a PARTNERSHIP and I hope no one is afraid to submit an idea. We will ALL learn along the way, make some mistakes and make some winners.

Let's have fun doing it too!

Happy Trading!

Wednesday, March 21, 2007

Crossroads with the Fed

Hey Gang:

Well "Uncle Ben" Bernancke and his other Fed Chiefs will be releasing their FOMC decision on interest rates today. The consensus is there will be no rate change. This of course will not move the markets much, but it is what they say in their statement that may. Inflation is still a concern, and the dollar has been weakened of late, so there may still be talk of a rate hike. That would send the market down and in the case of our chart, keep the $12,300 level as resistance. You'll see last time we hit this level from the post 2/27 fall, it followed up with a $240 point fall. I am not saying this will happen again, just that this run-up may have been a Bull Trap, and the markets will fall off here once again and we may become rangebound here.

If the Fed decides to LOWER interest rates, the market would EXPLODE higher here and we would make a Higher-High, indicating a resumed Bullish trend. We'll just have to wait and see.

Happy Trading!

Sunday, March 18, 2007

Quadruple Witch is Dead..now what?!?!

Hey Gang:

Hope y'all had a good weekend. Last week we had some more volatility with a $240 drop, then some recovery. Is this the "End of the Rainbow" for the Bears, or a "Bull Trap"? Let's take a look:

Here is a portion of the 5-Year Weekly Chart of the $INDU (Dow). You'll notice that we have begun to head down towards the top of the Major Resistance Line (support for us now) of the Major Ascending Channel (in Blue). If we bounce from here and continue up, this may signify a NEW Ascending Channel may have formed, and we could then use those support and resistance lines for analysis. But let's stay with what we DO know now. Let's take a closer look:

You'll notice that the $INDU has bounced off the aforementioned Major Ascending Channel Resistance line a couple of times already. Also, the MACD and STO are favorable towards an upward push. However, that being said we also have some other things to contend with...bad economic news, the forthcoming "Sell in May and Go Away" mantra, and more importantly, that Diagonal Resistance line I drew from the recent price action. At this time, it almost looks like a Decending Triangle since we are making Lower-Highs, and Equal-Lows. There is also talk that this "correction" is not over yet.

In Wall Street terms, a "correction" is a market drop-off of ten percent (10%). I have marked where that would fall to in a green box with "10%" in it. Once it hit there, it MAY be time to get into some positions. That would be an area where there could be some bargain hunting. Of course, I said "MAY" because if it hit there, we would be in a downtrend up to that point, so you need to be careful.

By the way, SBUX hit a bounce (like I predicted as a Triple Bottom) and took off on Friday. Full disclosure, I got taken out of this by my stop-loss on the -$240 day and did not re-enter due to Quadruple Witching Week which is always volatile. Anyway, keep an eye on it, it may come back a little bit.

Happy Trading!

Thursday, March 15, 2007

Wheeeeeeeeeeeeeeeeeeeee!!!

Are we having fun yet?

The Market has been a rollercoaster rids as of late, epitomized by yesterdays HUGE swing. For those of you who missed it, the Dow was down about $135 points yesterday in the morning, and even fell below the psychological $12,000 level for some brief moments.

Then it looked like a scene from Pamplona, Spain as the Bulls came charging back.

The Market then staged a HUGE rally to end UP over $57 points.

What to do, what to do? Honestly, the big drop on Tuesday took out about half my Stop-Loss levels (which I move on a daily basis depending on price movement up - never down), so some of my stocks taken out were for gains, albeit smaller ones. Some of the stocks were taken out for losses (smaller ones), and the other positions I closed out myself waiting to see what happens. Basically, I am in all cash right now. Yesterday may have been a "Dead Cat Bounce" from Tuesday's $240 point slide. I am not convinced the "correction" is over just yet.

I'll try to have some trading ideas over the weekend, which will be very busy for me since it is my wife's Baby Shower.

Happy Trading!

Monday, March 12, 2007

Managing Risk

Hey Gang:

After the BIG FALL back in late February, I thought I'd touch upon my FAVORITE trading topic: managing risk.

I am not at all ashamed to say that last year (my first full year of trading), I managed risk really poorly. Because of that, I got hammered in many plays I should not have. Sure, there were emotional ties to my trades, and I subjected myself to some "pride of ownership" issues (if I own it, it MUST be good) and for my sins, I lost a lot of money.

But I learned A LOT! Yes, the lessons were painful, humbling and downright nasty at times, but the end result was I completely changed my trading philosophy, and it paid off BIG TIME during that 400+ point meltdown recently. I really have to give my thanks to "Come Into My Trading Room" and my 3 Day Live classes in Salt Lake City for cementing the importance of Risk Management. In fact, I don't really trade anymore. I manage Risk.

What is it, and how do I do it?

Risk, in this case, is the exposure my portfolio has to the dangers of the market. The more exposure I have, the more risk (also known as "portfolio heat") I have. Having a lot of risk exposure is foolhardy at best, and downright stupid at worst. High Risk = High Stress, if things are going badly, your stress level increases exponentially, and trading under duress is a recipe for disaster. So avoid it at all costs. The nice thing about this, is that is it simple to manage risk and trade in control.

We all have worked hard for our money, and that last thing any of us wants is to take years of that labor and lose it on a surpise correction, or a piece of bad news that kills a position. Now NEWS is the great equalizer, it can destroy a great trade, or reverse a bad stock, or boost a good play to a great one. You want to protect yourself from the bad news, the good news will take care of itself.

To protect myself, and to minimize stress levels, I have hard and fast rules with my portfolios. They are rules that now are NEVER BROKEN. Here they are:

The RULES are the RULES because they are the RULES
  1. After the end of the last trading day in a calendar month, calculate the opening value of each portfolio by using the closing price of all equities, as well as the cash balance. This is my OPENING EQUITY AMOUNT.
  2. Calculate the current risk exposure in equities by using the closing price minus the Stop-Loss price.
  3. The MAXIMUM risk for any one trade is ONE PERCENT (1%) of the portfolio value. (Example - $25,000 portfolio = $250 MAXIMUM TRADE RISK on any one trade)
  4. The MAXIMUM risk exposure during the month for any portfolio is SIX PERCENT (6%). (Example - $25,000 portfolio = $1,500 MAXIMUM PORTFOLIO RISK)
  5. Position sizing must be rounded DOWN.
  6. Once a maximum of risk exposure of 6% is reached, you must STOP TRADING until such a point as an "At-Risk" trade moves to where the Stop-Loss price is increased to where if taken out, the play will be PROFITABLE. (I use Trailing Stops)
  7. If a trade is stopped out for a loss, that trade must remain in the risk management calculation until the following month.
  8. If the portfolio loses 6%, ALL TRADES (the profitable ones and non-profitable ones) must be closed, and I must wait until the following month to resume trading. This is a COOLING DOWN PERIOD (to prevent "Get Even-itis).
You can make up your own rules, but these seem to work for me.

Happy Trading!

Thursday, March 8, 2007

The Covered Call Play...

Hey Everyone, I just wanted to give an explanation on a Long-Term Covered Call play and how I use it for great Trend trades. The chart above is AKAM from last year. I have made several highlights and notations on how this play was handled.

You'll notice the first BUY signal at the bottom of the trend. Then, as the stock reached the top of the Ascending Channel, I would sell a Covered Call. You could play this one of two ways.

The first is more aggressive. You could sell an In-The-Money (ITM) Call for a nice premium with the expectation that the stock would fall below the strike, and you could buy it back on the cheap. This is how Delta works in your favor. An ITM strike has a high Delta, and as we know for every dollar movement in the stock (up or down), the option price moves accordingly. So as the stock prices moves down, the Delta burns off the Option price quickly, especially with the help of "Theta" (the Time Value decay rate).

The second Covered Call is conservative in that you are selling either an At-The-Money (ATM) or Out-of-the-Money (OTM) strike which gives you less premium, and does not burn off as fast as an ITM strike because the Delta is lower. The benefit is if you are called out, you'd make more money on the stock price.

In the example above, I would have bought the stock four (4) times, each time moving my Stop-Loss price to 3% below the recent support which helps capture the gains on the lower purchases. I also would have sold four (4) Covered Calls and then bought them back at the BUY line. In this case, I would have started buying positions at about $16.00, then closed out of the trade at about $32.00 when the trade closed two (2) consecutive days outside my Ascending Channel. You could make some very nice income on a stock like this, and it isn't even a "Buy and Hold" strategy since you are actively monitoring it.

Happy Trading!

Wednesday, March 7, 2007

Come Into My Trading Room

Hey Everyone:

Keith Volz has asked me to post the charts for the recent plays I made, and I am happy to do so. The charts should be pretty self-explanatory. I do this with ALL my charts, I set my BUY target area (or "bounce" area), as well as my "Target Price," which is one of my decision points to either take profits at resistance, or sell a Covered Call. By putting these right on the charts, it is very easy to see where I am in my trades. Reviewing them takes all of 2-5 seconds.

You'll notice that my plays usually are entered when the stock is at support and my MACD and STO are at their very bottom (or as close to them as possible). I normally DO NOT WAIT for 3 Green Arrows as I find that while it may be more "convincing," it is also less profitable. By playing earlier (when the MACD and STO begin to head up) I am buying at a lower price and therefore have less risk if I just play the 3 Green Arrows.

If I see a severe bounce, I may nibble a bit to test the waters, then wait for a pullback and buy more shares near support. The nibble gets me into the trade and if it soars from there, at least I have something. If it pulls back to support, I buy more because the Stop-Loss is the same (1% Swing, 3% Trend below recent support), but my entry price is lower, exposing me to less risk if the stock falls.

BHP
CLF
GRMN
PCL
PICO
SWK
Calling a Bottom

I also got into a small position of SBUX today. Now, from the looks of the chart, you may ask, "why would he buy a downtrending stock?" The simple reason is, "I believe it hit bottom." Here is the chart:You'll notice it hit this level twice before and bounced. It has bounced again and I got in a small position. I really don't know how high this could go over the following months. I suspect maybe those horizontal resistance levels may come into play, or even some Fibonnacci lines too if I draw them. Anyway, my reward/risk ratio seems pretty good, so we'll see how it plays out.

By the way, I bought SBUX back on 9/12/06 when it bounced making a Higher High and a Higher Low. That trade worked out very well! Needless to say, after exiting that trade (after 2 Covered Calls), I have waited patiently for it to come back to me. Maybe it has? Or maybe not?

Finally, let's revisit HUM:
The stock has definitely made a bounce here (making a Higher high) and I would consider getting in. You see a couple of Price Targets, make sure your portfolio positioning is reasonable (I never expose more than 1% of downside in any one stock), and go for it (not a recommendation to buy).

Happy Trading!