Thursday, March 15, 2007

Wheeeeeeeeeeeeeeeeeeeee!!!

Are we having fun yet?

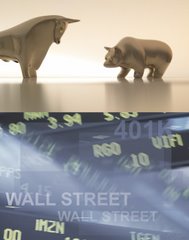
The Market has been a rollercoaster rids as of late, epitomized by yesterdays HUGE swing. For those of you who missed it, the Dow was down about $135 points yesterday in the morning, and even fell below the psychological $12,000 level for some brief moments.

Then it looked like a scene from Pamplona, Spain as the Bulls came charging back.

The Market then staged a HUGE rally to end UP over $57 points.

What to do, what to do? Honestly, the big drop on Tuesday took out about half my Stop-Loss levels (which I move on a daily basis depending on price movement up - never down), so some of my stocks taken out were for gains, albeit smaller ones. Some of the stocks were taken out for losses (smaller ones), and the other positions I closed out myself waiting to see what happens. Basically, I am in all cash right now. Yesterday may have been a "Dead Cat Bounce" from Tuesday's $240 point slide. I am not convinced the "correction" is over just yet.

I'll try to have some trading ideas over the weekend, which will be very busy for me since it is my wife's Baby Shower.

Happy Trading!

Monday, March 12, 2007

Managing Risk

Hey Gang:

After the BIG FALL back in late February, I thought I'd touch upon my FAVORITE trading topic: managing risk.

I am not at all ashamed to say that last year (my first full year of trading), I managed risk really poorly. Because of that, I got hammered in many plays I should not have. Sure, there were emotional ties to my trades, and I subjected myself to some "pride of ownership" issues (if I own it, it MUST be good) and for my sins, I lost a lot of money.

But I learned A LOT! Yes, the lessons were painful, humbling and downright nasty at times, but the end result was I completely changed my trading philosophy, and it paid off BIG TIME during that 400+ point meltdown recently. I really have to give my thanks to "Come Into My Trading Room" and my 3 Day Live classes in Salt Lake City for cementing the importance of Risk Management. In fact, I don't really trade anymore. I manage Risk.

What is it, and how do I do it?

Risk, in this case, is the exposure my portfolio has to the dangers of the market. The more exposure I have, the more risk (also known as "portfolio heat") I have. Having a lot of risk exposure is foolhardy at best, and downright stupid at worst. High Risk = High Stress, if things are going badly, your stress level increases exponentially, and trading under duress is a recipe for disaster. So avoid it at all costs. The nice thing about this, is that is it simple to manage risk and trade in control.

We all have worked hard for our money, and that last thing any of us wants is to take years of that labor and lose it on a surpise correction, or a piece of bad news that kills a position. Now NEWS is the great equalizer, it can destroy a great trade, or reverse a bad stock, or boost a good play to a great one. You want to protect yourself from the bad news, the good news will take care of itself.

To protect myself, and to minimize stress levels, I have hard and fast rules with my portfolios. They are rules that now are NEVER BROKEN. Here they are:

The RULES are the RULES because they are the RULES
  1. After the end of the last trading day in a calendar month, calculate the opening value of each portfolio by using the closing price of all equities, as well as the cash balance. This is my OPENING EQUITY AMOUNT.
  2. Calculate the current risk exposure in equities by using the closing price minus the Stop-Loss price.
  3. The MAXIMUM risk for any one trade is ONE PERCENT (1%) of the portfolio value. (Example - $25,000 portfolio = $250 MAXIMUM TRADE RISK on any one trade)
  4. The MAXIMUM risk exposure during the month for any portfolio is SIX PERCENT (6%). (Example - $25,000 portfolio = $1,500 MAXIMUM PORTFOLIO RISK)
  5. Position sizing must be rounded DOWN.
  6. Once a maximum of risk exposure of 6% is reached, you must STOP TRADING until such a point as an "At-Risk" trade moves to where the Stop-Loss price is increased to where if taken out, the play will be PROFITABLE. (I use Trailing Stops)
  7. If a trade is stopped out for a loss, that trade must remain in the risk management calculation until the following month.
  8. If the portfolio loses 6%, ALL TRADES (the profitable ones and non-profitable ones) must be closed, and I must wait until the following month to resume trading. This is a COOLING DOWN PERIOD (to prevent "Get Even-itis).
You can make up your own rules, but these seem to work for me.

Happy Trading!

Thursday, March 8, 2007

The Covered Call Play...

Hey Everyone, I just wanted to give an explanation on a Long-Term Covered Call play and how I use it for great Trend trades. The chart above is AKAM from last year. I have made several highlights and notations on how this play was handled.

You'll notice the first BUY signal at the bottom of the trend. Then, as the stock reached the top of the Ascending Channel, I would sell a Covered Call. You could play this one of two ways.

The first is more aggressive. You could sell an In-The-Money (ITM) Call for a nice premium with the expectation that the stock would fall below the strike, and you could buy it back on the cheap. This is how Delta works in your favor. An ITM strike has a high Delta, and as we know for every dollar movement in the stock (up or down), the option price moves accordingly. So as the stock prices moves down, the Delta burns off the Option price quickly, especially with the help of "Theta" (the Time Value decay rate).

The second Covered Call is conservative in that you are selling either an At-The-Money (ATM) or Out-of-the-Money (OTM) strike which gives you less premium, and does not burn off as fast as an ITM strike because the Delta is lower. The benefit is if you are called out, you'd make more money on the stock price.

In the example above, I would have bought the stock four (4) times, each time moving my Stop-Loss price to 3% below the recent support which helps capture the gains on the lower purchases. I also would have sold four (4) Covered Calls and then bought them back at the BUY line. In this case, I would have started buying positions at about $16.00, then closed out of the trade at about $32.00 when the trade closed two (2) consecutive days outside my Ascending Channel. You could make some very nice income on a stock like this, and it isn't even a "Buy and Hold" strategy since you are actively monitoring it.

Happy Trading!

Wednesday, March 7, 2007

Come Into My Trading Room

Hey Everyone:

Keith Volz has asked me to post the charts for the recent plays I made, and I am happy to do so. The charts should be pretty self-explanatory. I do this with ALL my charts, I set my BUY target area (or "bounce" area), as well as my "Target Price," which is one of my decision points to either take profits at resistance, or sell a Covered Call. By putting these right on the charts, it is very easy to see where I am in my trades. Reviewing them takes all of 2-5 seconds.

You'll notice that my plays usually are entered when the stock is at support and my MACD and STO are at their very bottom (or as close to them as possible). I normally DO NOT WAIT for 3 Green Arrows as I find that while it may be more "convincing," it is also less profitable. By playing earlier (when the MACD and STO begin to head up) I am buying at a lower price and therefore have less risk if I just play the 3 Green Arrows.

If I see a severe bounce, I may nibble a bit to test the waters, then wait for a pullback and buy more shares near support. The nibble gets me into the trade and if it soars from there, at least I have something. If it pulls back to support, I buy more because the Stop-Loss is the same (1% Swing, 3% Trend below recent support), but my entry price is lower, exposing me to less risk if the stock falls.

BHP
CLF
GRMN
PCL
PICO
SWK
Calling a Bottom

I also got into a small position of SBUX today. Now, from the looks of the chart, you may ask, "why would he buy a downtrending stock?" The simple reason is, "I believe it hit bottom." Here is the chart:You'll notice it hit this level twice before and bounced. It has bounced again and I got in a small position. I really don't know how high this could go over the following months. I suspect maybe those horizontal resistance levels may come into play, or even some Fibonnacci lines too if I draw them. Anyway, my reward/risk ratio seems pretty good, so we'll see how it plays out.

By the way, I bought SBUX back on 9/12/06 when it bounced making a Higher High and a Higher Low. That trade worked out very well! Needless to say, after exiting that trade (after 2 Covered Calls), I have waited patiently for it to come back to me. Maybe it has? Or maybe not?

Finally, let's revisit HUM:
The stock has definitely made a bounce here (making a Higher high) and I would consider getting in. You see a couple of Price Targets, make sure your portfolio positioning is reasonable (I never expose more than 1% of downside in any one stock), and go for it (not a recommendation to buy).

Happy Trading!

The End of the Fall?

Hey y'all:

A quick post for this morning on something I noticed yesterday. I looked at the "Big Picture" on the Dow yesterday and discovered something VERY interesting. Take a look:

This is a part of the 5 Year chart. You'll notice that the index was traveling beautifully inside an Ascending Channel until about October of '05, at which point it broke above the channel. I then have two "minor" Channels above the "major" with the most recent one being somewhat tepid, or less steep. This indicated that the trend was losing steam. Of course we all know the WALLOP the market gave most of us last week. The question on ALL of our minds was, "when will this end?"

It may have ended now.

See the way the index "bounced" of the top of the "major" channel? Pretty amazing huh? Remember gang, previous resistance becomes new support when resistance is broken. That is exactly what happened here.

What does it all mean?

Well, it may mean that the "correction" has ceased, but I can't be certain. If we see a greater move up from here we need to be careful. In order to continue the Bullish trend we need a Higher High. I am not sure we will get it here as the market may sideways trend here for a bit before deciding what it want to do. Yesterday may also have been a "Dead Cat Bounce" (I didn't make the term up for all you cat-lovers), which is a "short term spike after a tremendous downfall." Basically a DCB is a Band-Aid on a major wound giving temporary relief to the Bulls. The fall may not be over yet, be careful!

Some ideas. I "dipped my toe in" to test the market by opening small positions in the following (not a recommenbdation to buy):

BHP
CLF
GRMN
PCL
PICO
SWK

Happy Trading!

Monday, March 5, 2007

A "Mayoral Candidate"

Our esteemed "Mayor Pro Tem" of Jamestown, Keith Volz made a comment on yesterday's post. He asked me my thoughts on WCG as a Covered Call trade. While I don't know if Keith is already in this play, let's take a look, shall we? Here's the chart:First off all, where the HECK was I when this baby broke 3 Green Arrows last July? Holy smokes, talk about a stock "en fuego" (that's "on fire" for you Gringos). WCG has doubled in price in less than a year. Certainly a strong, uptrending stock. However, it is at the top of an Ascending Channel and the MACD and STO indicate a pullback is imminent. I would wait until this drops into my highlighted area (or at least to that bottom line) and look for a bounce to get in. I would then ride it up to the top and depending on how much it rose, sell a Covered Call. Say it drops to $75, I buy. Then if it gets close to the top of the channel again, I wait till it begins to fall back, then sell my CC. For example, if the top of the channel is $88, I would sell an $85 instead of a $90. Why? Well, the premium would be much better since I am already $2-3 In The Money, so I would get that intrinsic value. But also, since it is falling, I expect it to fall below $85 before expiration. Since Delta is working in my favor on the downside, once the stock hits the channel support, I buy back the call for a little bit of money and retain ownership of the stock. I may even add more to my position down here on a bounce, then let it ride up to the channel top and sell even more Calls. I'll try to create an example of this method in a few days so everyone can see what I mean.

Anyway, great stock Keith...why didn't you tell me about this back in July/August? =P

Happy Trading!

Sunday, March 4, 2007

Some "Boring" suggestions (wink)

Contrary to the title of this post, Jeff Boring sent me some ideas for this week. Now, I am no soothesayer so I can't predict what will happen, but let's at least look at some possibilities. Remember, we want to try to follow the prevailing trend of the overall market. "A rising tide lifts ALL boats (and drops them too on a falling tide!)"

Jeff noticed that the Insurance industry seemed to be making a move and gave some stock suggestions. I'll post the charts and give my personal thoughts (which you may or may not agree with) as to what I see. I am never judgemental about someone, especially with what they are looking at, but I certainly will give what would be my analysis of the same.

Here they are: AGP, HLEX, HUM, and UNH (Click on the chart to enlarge, then use the "Back" icon on your browser to return to the Blog)

AGPNow, while AGP seems to be hitting support, and the MACD and STO are favorable for an upturn, the stock has made a lower, low, and the 30DMA and 100DMA are falling, which is Bearish. The 200DMA is flat which is Neutral. I, for one would not play this yet, but may look at a BEARISH play if it makes a lower high, then begins to fall.


HLEXDefinitely a WATCH LIST stock IMHO (In My Humble Opinion). It has reached the top of its channel and the MACD and STO indicate a fall back to support here is possible. If it falls back to both above the lower channel support and above the downward Purple diagonal resistance line, I am buying on the bounce and selling Covered Calls at the top. This could be starting a long term uptrend. Notice the operative word "could."


HUMDefinitely watch this stock. It hit resistance in its channel at the Median Line and has fallen back a bit. The STO and MACD may still have some downside, but it looks like the stock has found support above the red dotted line (Old support). If we get a little bounce, you see where my targets are. Not sure if the Reward/Risk is worth it here, but certainly worth doing some more investigation on your own.


UNHAgain, a stock to keep an eye on. This is CLASSIC INVESTools Method...3 Green Arrows on an uptrending stock with good volume. Resistance is the Median Line in the channel and you could see my price targets.

Don't forget your Stop-Loss entries whenever you place and execute a BUY order. As soon as the trade is placed, you should IMMEDIATELY enter your Stop-Loss (you should ALWAYS know where that is BEFORE you place your buy order).

Be sure to give us some more ideas we can all share.

Happy Trading!